Researching in Math – Kiara McDonald’s Research Showcase
What comes to mind when you hear the phrase “Scientific Research”? To most people, this phrase would make you think of a scientist, who is probably wearing a lab coat and goggles, analyzing some sort of chemical or bacteria through a microscope. This scientist follows their well-defined methodology in order to test their hypothesis on collected samples. This idea of scientific research represents how most research is conducted in the biological, social and physical sciences, but it is not a completely accurate image of the mathematical research process.
When I first started my undergraduate degree in mathematics, I had no idea what mathematical research looked like. All throughout high school and my first two years of university, I was taught that the way to conduct scientific research was to follow a clear and well-planned methodology; however, when I did my first research project in mathematics, I learned that the process for my faculty was not quite the same. In mathematics, we do not follow a “well-defined methodology”. Instead, we try out many different examples and try to deduce patterns from those examples; this phase is similar to forming a hypothesis. However, we then need to prove that the “pattern” we found holds true for all possible cases. Verifying a finite number of cases supports our idea, but we need an airtight logical proof that works for infinite cases. We deduce our results from axioms, rather than observed behaviour. Another common technique in mathematical research is to look at a problem restricted to certain mathematical structures, to make use of the special properties of such structures in our proofs. To see a real example of the mathematical research process, I’m going to share my experience from my first research project.
In the summer of 2022, I received the NSERC USRA scholarship to conduct mathematical research under the supervision Dr. Richard Brewster. Our research was in the area of graph theory, looking at an idea called broadcasting. As an analogy to describe our problem in simple terms, imagine a city with houses and cell towers. There is a distance between each of the buildings within the city. We allow each of the cell towers to have a broadcasting power; we say that any building within distance less than or equal to the power of the cell tower receives the signal from that tower.
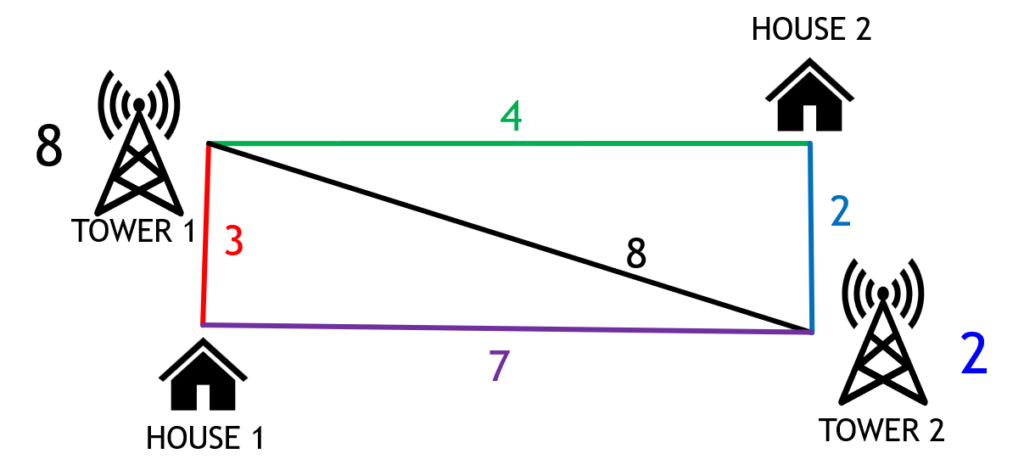
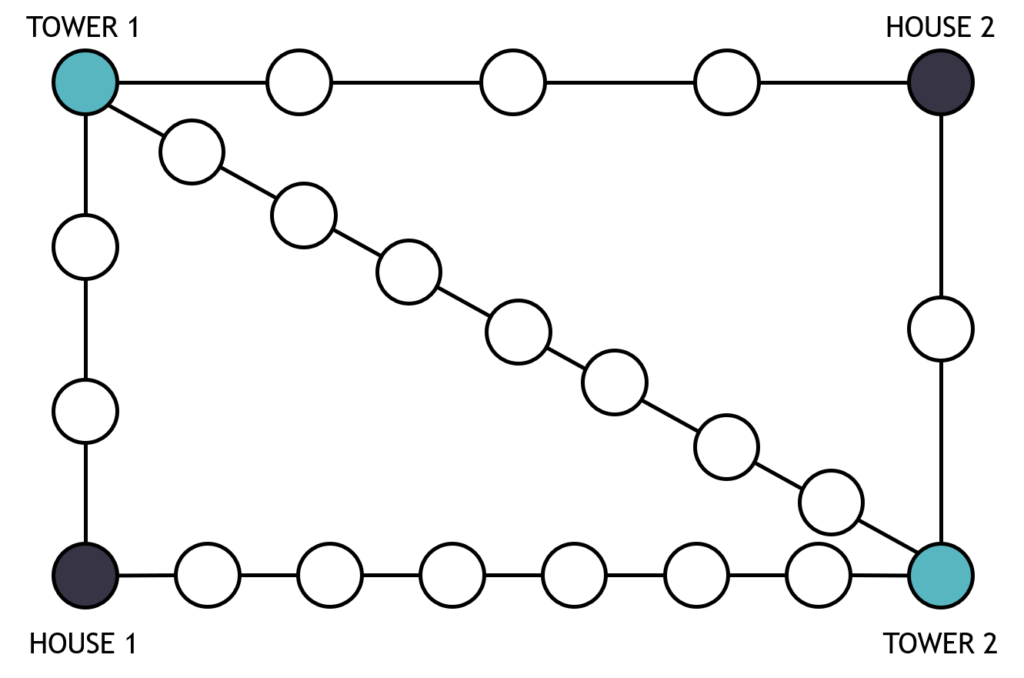
The second picture above shows the city example converted to a graph. The circles are called nodes and the lines between them are called edges. From the previous example, the navy nodes represent the houses and the turquoise nodes represent the cell towers. The distance between the nodes is the number of edges between them. In this example, we already had the towers placed. Part of solving the independence broadcast problem is figuring out where to place the broadcasting nodes, which are analogous with the cell towers. So, the starting point for our problems are actually graphs where no broadcasting nodes have been placed.
We can impose certain conditions on our broadcasts. If we do not allow cell towers to receive a signal from another cell tower, we call this an independent broadcast. A packing broadcast is one in which we do not allow signals to interfere at any building. In our project, we wanted to find the maximum total power of independent and packing broadcasts, called the broadcast independence number and the broadcast packing number respectively, within certain classes of graphs. There is no given formula for these numbers, so our research is not as simple as just plugging in numbers; we need to discover the formulas ourselves.
At the start of our project, I started reading through literature on already known broadcast independence and broadcast packing numbers. The main results were within paths and cycles; in graph theory, restricting the problem to paths and cycles is the usual starting point for a lot of research. After reading the known results, we looked at finding the broadcast independence number within a class of graphs called grid graphs. Using SageMath and another area of math called Linear Programming, we generated examples of the broadcast independence number in different sizes of grid graphs. Unfortunately, there was no clear pattern in the independent broadcasts or the broadcast independence number of these graphs. This is an unfortunate reality of research in graph theory; not every graph structure yields clear results. However, just because one class does not work out, that does not mean that others will not.
Based off a question posed by Ahmane et al. in their paper On the broadcast independence number of caterpillars, we decided to turn our attention to looking at the broadcast independence number within perfect binary and k-ary trees. A perfect binary tree is a graph consisting of a root node, which is the node at the top of the graph, and all nodes have exactly 2 children nodes. The height of the tree is the number of edges between the root node and a leaf node, which is a node with no children. A perfect k-ary tree follows the same structure, except each node has k-children nodes, instead of 2. A tree of each type is pictured below.
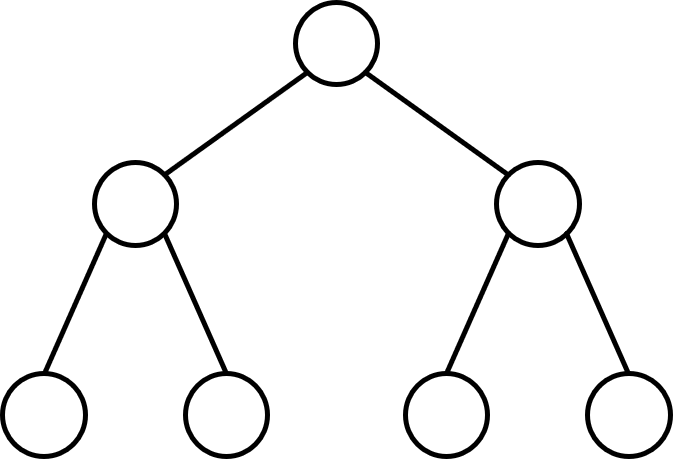
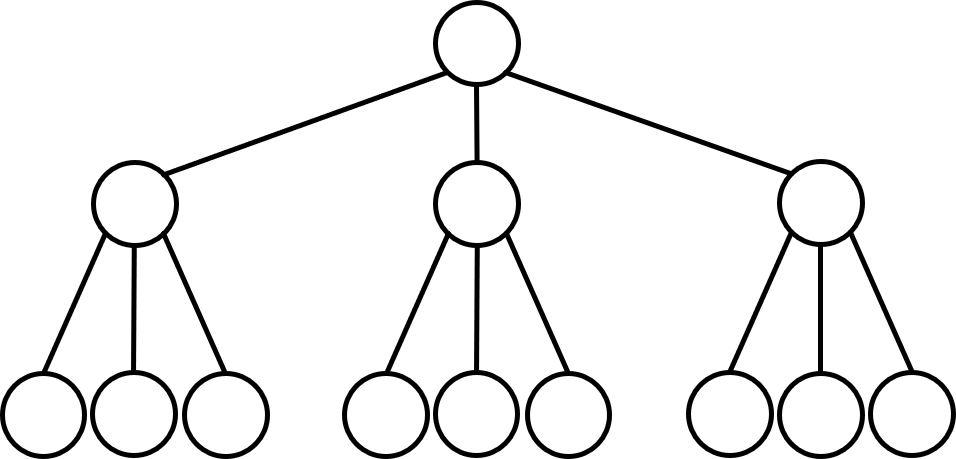
Just like the process with grid graphs, we used SageMath and Linear Programming to generate examples of the broadcast independence number in different heights of binary and k-ary trees. Luckily, we were able to discern patterns in these examples. For the perfect binary trees, we noticed that all maximum independent broadcasts had a pattern of broadcasting with power 3 from the leaves. In perfect k-ary trees, there was a similar pattern of broadcasting from the leaves, but with power 1 instead of 3. There were also other broadcasting patterns within the internal layers of the tree and the root of the tree, dependent on the height of the tree. Using the special structure of these trees, we proved that the patterns we observed were true for all perfect binary and k-ary trees. Based on these proofs, we were able to create a formula for the broadcast independence number in these trees.
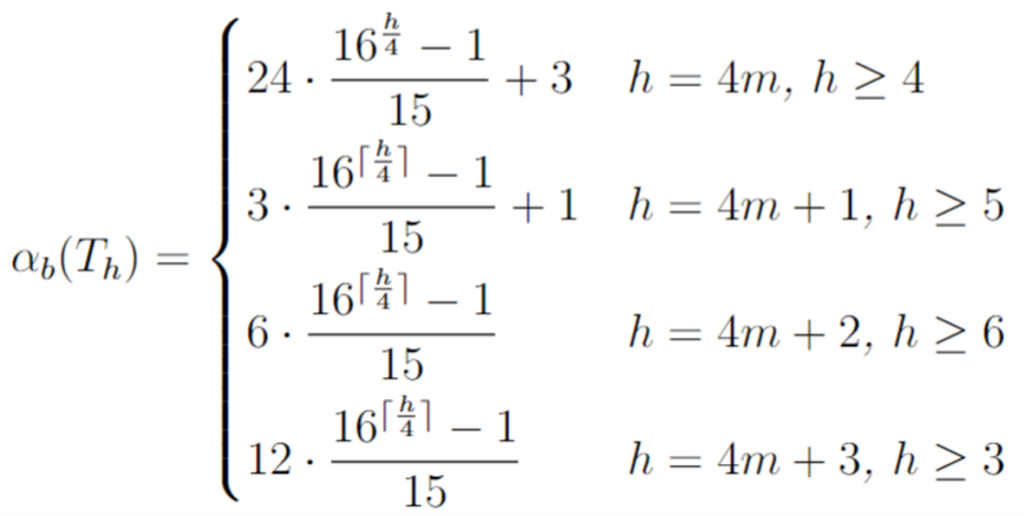
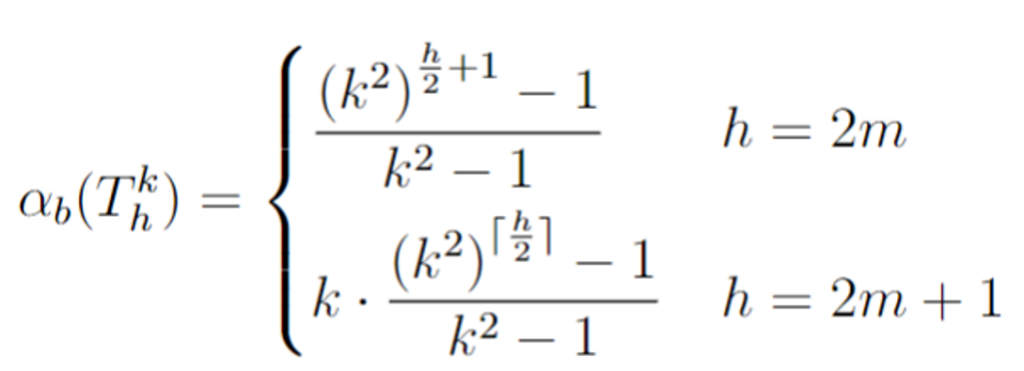
Following a similar process of using code to generate examples, discerning patterns from the examples and proving the patterns that we found are true for all graphs within that class, we were also able to determine an explicit formula for the broadcast packing number within perfect binary and k-ary trees. Further, we found results within other subclasses of graphs called 1-caterpillars, spiders and double spiders. We determined algorithms for finding the broadcast independence number in spiders and for creating a multicover of double spider. We also found the broadcast packing number of spiders, and the broadcast packing number of 1-caterpillars.
Through my mathematics research, I discovered that the “scientific process” is diverse amongst different sciences. In mathematics, we do not lead the research; the research leads us. We cannot create a clear methodology like we can in other sciences. We need to work through examples first in order to see what we need to prove. Furthermore, I learned that even though our ideas do not always work out, that does not mean we cannot find results down a different path. The key to being a good mathematics researcher is to persevere, to take everything you can out of the entire experience, even the parts that do not work out, and to be open to new ways of thinking and learning.

